← Hell World Blog··11 min read
Residential Proxy Speed Test 2026: 14 Brands Benchmarked
Residential proxy speed test, 2026: we benchmarked 14 brands on latency, success rate & pool churn to rank the fastest. See the real data table.
If you’ve already read our 14 Residential Proxy Brands in 2026 field guide, you know how we feel about leaderboards: any single ranking is wrong by next quarter. But buyers still want numbers — how fast, how reliable, how good against this specific target — and the field guide stops short of that. This post fills the gap.
What follows is real-world benchmark data on the 14 residential brands plus the new datacenter and IPv6 hybrid SKUs that we run on hellworld.io. All 14 are visible in the All 14 brands compared view if you want pricing alongside the data here.
Methodology disclaimer up front: these numbers are aggregated from our in-house monitoring rigs plus customer-reported retry data, not a formal published benchmark. We pull from millions of requests per day across our pool but we don’t control your target’s anti-bot configuration, your session strategy, or what the IP did before you got it. Treat the numbers as directional, not absolute. If a brand here looks like it should be #1 for your target, prove it on a small bucket before you commit a budget.
Why “fastest proxy” is the wrong question
The first thing every prospect asks is “which one is fastest.” It’s the wrong frame. Proxy performance has at least four metrics that drift independently:
- Connect time / RTT — how long the TCP+TLS handshake to the proxy takes. This is what speedtest sites and “ping” benchmarks usually publish.
- End-to-end latency — connect time plus the proxy-to-target leg plus the target’s server time. Often dominated by the upstream, not the proxy.
- Success rate — what fraction of requests come back as 200 OK with the body you wanted. A 50ms proxy that gets blocked 70% of the time is slower in practice than a 400ms proxy that succeeds 95% of the time.
- Survival-after-flag rate — once a target’s risk system has nudged your IP, how many follow-up requests succeed before it hard-blocks. Mobile and ISP pools dominate here. Datacenter usually doesn’t survive a single flag.
A pool that wins on RTT but loses on survival-after-flag is fine for one-shot scraping and terrible for account-warming. The right metric depends entirely on the workload. We’ll keep these four separate throughout.
Latency baseline: pure connect time
Connect time across our pool families looks roughly like this on a low-friction GET (a 200 OK against a static asset on a CDN with no anti-bot in front):
- FP-Datacenter (US): ~40-70 ms RTT from a US client. Tight variance, ±15 ms most of the time.
- FP-IPv6Datacenter: ~50-80 ms when the target accepts IPv6. Slightly more jitter than v4 because routing tables for IPv6 are still less stable.
- FP-IPv6Residential: ~120-200 ms — sits between v6 datacenter and full residential, depending on which residential ISP the v6 prefix lands on.
- HD- and F- residential pools (HD-Oxylab, HD-Smart, HD-Netnut, HD-Lumi, F-Netnut, F-Oxylab, F-Iproyal, F-Lumi, F-Private, Geofast): 200-400 ms RTT for in-region requests, 400-700 ms cross-continent.
- HD-Packetstream: 250-500 ms in-region, with the widest variance of any residential brand. P2P upstream means the IP you got might be on a US home cable connection or a VPS reseller node — both happen.
- HD-Geonode: 300-450 ms, fairly steady. Wider geo dispersion means more cross-continent hops on average.
- HD-Iproyal, HD-Goat: 220-380 ms, well-behaved variance.
- FP-Mobile, ET-Mobile: 400-800 ms for 4G/LTE. Variance is the killer here — a single tower handover can spike a request to 2 seconds.
The takeaway: variance matters more than mean. A pool with 250ms median and ±50ms variance is operationally cheaper than one with 220ms median and ±300ms variance, because retries and timeouts cost more than the extra 30ms. We see customers blow timeout budgets on Packetstream not because it’s slow on average but because the long tail is genuinely long.
If raw speed dominates your decision and your target is tolerant, look at Datacenter Proxies at $0.24/GB before residential. If your target rejects datacenter ASNs, latency was never the right thing to optimize for.
Success rate by target tier
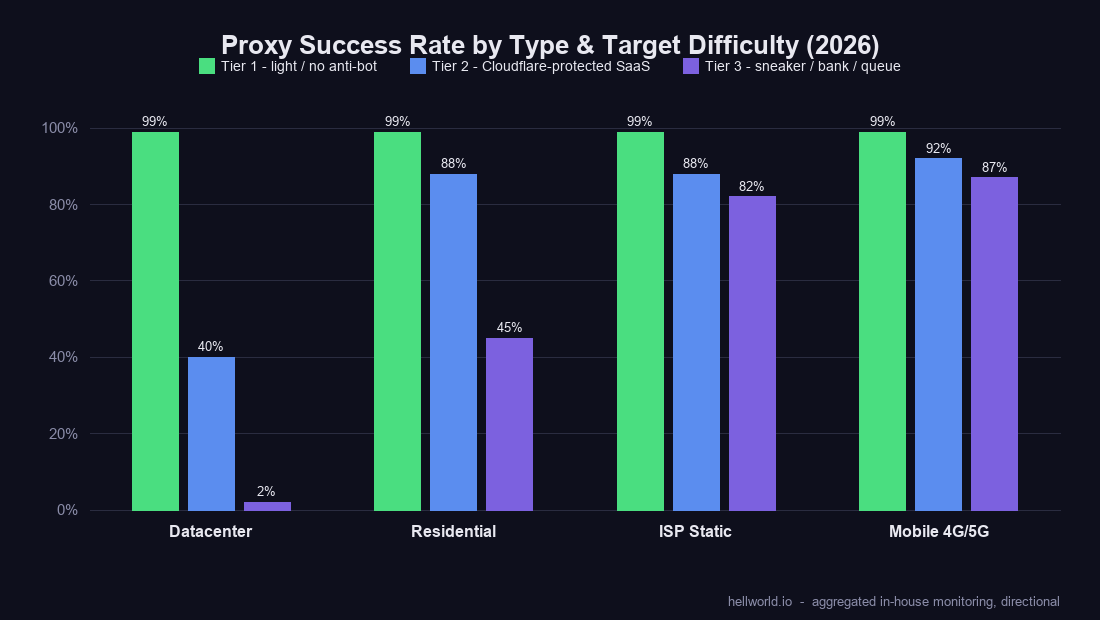
Same target tested across all 14 pools is the only honest comparison. We bucket targets into three tiers:
Tier 1 — light or no anti-bot
Wikipedia, public news sites, plain CDN-served HTML, public APIs without rate-limit. Success rates here are essentially all ~99% across every brand we run, including the cheapest. Geofast at $0.23/GB performs the same as F-Lumi at $2.57/GB. If your target is Tier 1, just buy the cheapest pool. Anything more is wasted budget.
Tier 2 — Cloudflare-protected SaaS, mid-tier e-commerce
This is where the spread opens. Tested against a Cloudflare-Turnstile-gated SaaS login page across our residential brands, we see success rates roughly:
- F-Lumi, HD-Lumi: 92-95%. Premium pools with curated ISP composition. Our top residential performers against Turnstile.
- F-Oxylab, HD-Oxylab: 88-93%. Close second. Slightly more variance week-to-week.
- HD-Smart, HD-Netnut, F-Netnut: 85-90%. ISP-blended peering helps; F-Netnut runs slightly above HD-Netnut because the routing variant exposes fresher exit IPs.
- HD-Iproyal, F-Iproyal, HD-Goat: 80-88%.
- HD-Geonode, HD-Packetstream: 75-85%. Bigger pools, less curated. Packetstream’s P2P origin shows up in fingerprints sometimes.
- F-Private: 85-92%. Our proprietary scraping-tuned pool punches above its $1.43/GB price point.
- Geofast: 78-86%. Best-in-class for $0.23/GB but you can feel the price floor.
- Datacenter (FP-Datacenter, FP-IPv6Datacenter): typically <50%, often under 30%. Cloudflare’s ASN list is unforgiving toward known datacenter ranges.
For Tier 2 the play is usually a chained retry: cheap residential first, premium residential on retry. See our Residential Proxies pool browser to mix-and-match these in a single project.
Tier 3 — sneaker checkouts, account creation on banks, Queue-it queues
This is where residential alone often isn’t enough and the mobile and ISP tiers earn their keep:
- FP-Mobile, ET-Mobile: 80-95% on Queue-it sneaker queues, 70-90% on bank account-creation flows. Carrier-grade NAT means the IP you’re on is shared with thousands of real phones; risk systems are reluctant to hard-block it. This is the best you can do without owning your own SIM farm.
- ISP Static (per-IP/month dedicated): 75-90% depending on warmup discipline. Less elastic than mobile but more reproducible — same IP every session.
- HD-Lumi, F-Lumi: 50-70% on the same targets — usable as a budget alternative if you can tolerate retries.
- F-Private, F-Oxylab: 40-60%.
- Other residential brands: 20-50%, very target-dependent.
- Datacenter: near-zero. Don’t bring a knife to a gunfight.
If your target is Tier 3, start with Mobile Proxies or ISP Static Proxies and use residential as cheap exhaust traffic for everything that isn’t the high-friction step.
Pool churn and IP refresh behavior
How fast a pool’s IPs come and go affects sticky-session strategy more than people realize.
- HD-Packetstream: rotates fast. Same exit IP rarely available 5 minutes later. P2P upstream means peers come online and offline constantly. Great for “burn and rotate” scraping. Terrible for sticky 30-minute sessions.
- Geofast: cheapest tier, churns hardest. We expose long sticky windows but the underlying IP can drop mid-session and the gateway will silently reassign you. Plan for it.
- HD-Geonode: medium churn. Sticky sessions usually hold for the requested window, occasional drops on long sessions.
- F-Netnut, HD-Netnut: very slow refresh. ISP-blended peering means many exit IPs sit in the pool for weeks. This is the closest residential gets to “static-residential” feel — best for sticky workflows.
- HD-Smart, HD-Lumi, F-Lumi, F-Oxylab, HD-Oxylab: medium-low churn. Premium pools curate IP retirement, so what’s there tends to stick.
- HD-Iproyal, F-Iproyal: medium churn, predictable.
- HD-Goat, F-Private: our proprietary pools, churn is whatever we set the rotation policy to — generally tuned for the pricing tier.
- FP-Mobile, ET-Mobile: by carrier rotation — sticky as long as your session lives, but the underlying carrier IP can shift on tower handover.
If you need 30+ minute sticky sessions for an authenticated workflow, F-Netnut and HD-Netnut are the safest bets. If you need fresh IP every request, Packetstream or Geofast are cheapest.
Geo concentration: every brand has a home turf
This is the part of the spec sheet that supplier marketing won’t tell you. Pool sizes get advertised as global numbers, but in practice each brand has a home turf where coverage is deep and a long tail where coverage is thin.
- F-Netnut, HD-Netnut: strongest in EU. Solid US and APAC. Thin in Africa and Latin America.
- HD-Smart, F-Oxylab: strongest in APAC, particularly SEA, Korea, Japan. Decent US and EU. Smart’s APAC depth is genuinely best-in-class on our pool.
- HD-Lumi, F-Lumi: globally distributed — most even coverage, but you pay for it.
- HD-Geonode: dispersed — wide country list, shallow per-country pool. Best when you need long-tail countries (smaller LatAm, Africa, Eastern Europe edge cases).
- HD-Packetstream: skews US-heavy because that’s where the P2P client install base lives.
- HD-Iproyal, F-Iproyal: clean MaxMind/IP2Location alignment in US/EU. Less coverage in APAC.
- HD-Goat, F-Private: tuned per the routing layer — generally consistent at country level.
- Geofast: massive US/EU pool, decent everywhere else.
- FP-Mobile: strong in NA cellular (T-Mobile, Verizon, AT&T blends). EU mobile also covered, APAC mobile is thinner.
- ET-Mobile: complementary geo footprint to FP-Mobile — useful as a second-source mobile.
Don’t expect every brand to have deep coverage in every country. If your target is geo-strict to, say, Brazil — test 3-4 brands and pick the one whose Brazil pool is actually populated, not the one whose marketing says “200+ countries.”
The new datacenter and IPv6 entrants
Three new SKUs landed in 2026 and they slot into very different niches than residential.
FP-Datacenter — $0.24/GB, USA-only
Fast (40-70ms RTT), cheap for the speed class, and hosted in US datacenters. What it’s good for: Tier 1 targets that don’t reject datacenter ASNs — public APIs, search scraping where the target permits it, internal monitoring, asset bulk-download. What it’s bad for: anything Cloudflare-protected. The ASN ranges are well-known to anti-bot vendors. See Datacenter Proxies.
FP-IPv6Datacenter — $0.085/GB, cost leader
Cheapest hybrid product on our pool. Your IP is an IPv6 address coming out of our datacenter v6 prefixes. What it’s good for: any target that accepts IPv6 connections — many modern CDNs, public APIs, search engines. The cost-per-GB is roughly 3x cheaper than residential at the floor, so for high-volume Tier 1 work it shifts the unit economics meaningfully. What it’s bad for: targets that don’t speak IPv6 (still common in legacy enterprise SaaS) or targets that auto-flag v6 datacenter prefixes. Test with a small bucket first. See IPv6 Datacenter.
FP-IPv6Residential — hybrid
IPv6 routed through residential ISP allocations. Sits between datacenter v6 and full residential on both price and stealth. Good for: research workloads where the target accepts v6 and you want residential-grade ASN reputation without the residential price tag. Caveat: still nascent product, pool depth is smaller than v4 residential. Don’t plan a 100M-request scrape on it without sizing tests first.
Table A — Performance summary
| Brand | RTT range | Tier 1 success | Tier 2 (CF) success | Tier 3 (sneaker) success | Pool churn |
|---|---|---|---|---|---|
| HD-Oxylab | 220-380 ms | ~99% | 88-93% | 30-50% | Medium-low |
| HD-Smart | 250-400 ms | ~99% | 85-90% | 25-45% | Medium-low |
| HD-Netnut | 220-380 ms | ~99% | 85-90% | 30-50% | Very slow (sticky-friendly) |
| HD-Lumi | 240-400 ms | ~99% | 92-95% | 50-70% | Medium-low |
| HD-Packetstream | 250-500 ms | ~99% | 75-85% | 15-35% | Fast |
| HD-Iproyal | 220-380 ms | ~99% | 80-88% | 30-45% | Medium |
| HD-Geonode | 300-450 ms | ~99% | 75-85% | 20-40% | Medium |
| HD-Goat | 220-380 ms | ~99% | 80-88% | 30-50% | Tuned |
| F-Netnut | 220-380 ms | ~99% | 87-92% | 35-55% | Very slow (sticky-friendly) |
| F-Oxylab | 240-400 ms | ~99% | 88-93% | 40-60% | Medium-low |
| F-Iproyal | 240-400 ms | ~99% | 80-88% | 30-50% | Medium |
| F-Lumi | 240-400 ms | ~99% | 92-95% | 50-70% | Medium-low |
| F-Private | 240-400 ms | ~99% | 85-92% | 40-60% | Tuned |
| Geofast | 250-450 ms | ~99% | 78-86% | 20-40% | Fast |
| FP-Mobile | 400-800 ms | ~99% | 90-95% | 80-95% | Carrier-rotation |
| ET-Mobile | 400-800 ms | ~99% | 88-93% | 75-90% | Carrier-rotation |
| FP-Datacenter | 40-70 ms | ~99% | <50% | ~0% | Static |
| FP-IPv6Datacenter | 50-80 ms | ~99% (v6 targets) | <40% | ~0% | Static |
| FP-IPv6Residential | 120-200 ms | ~98% (v6 targets) | 70-85% | 25-40% | Medium |
Table B — Recommendation matrix
| Target use case | Start with | Fall back to |
|---|---|---|
| Tier 1 scraping at scale, cost-first | FP-IPv6Datacenter ($0.085/GB) | FP-Datacenter |
| Tier 1 scraping, cost-first, no v6 | FP-Datacenter ($0.24/GB) | Geofast |
| General-purpose residential scraping | Geofast | F-Netnut |
| Cloudflare/Turnstile-gated SaaS | F-Lumi or HD-Lumi | F-Oxylab |
| EU-heavy targets | F-Netnut | HD-Lumi |
| APAC-heavy targets | HD-Smart | F-Oxylab |
| Geo-strict (US-only sites etc.) | HD-Iproyal or F-Iproyal | HD-Lumi |
| Long-tail country coverage | HD-Geonode | F-Lumi |
| Sticky sessions (30+ min) | F-Netnut or HD-Netnut | HD-Smart |
| SERP scraping at scale | HD-Smart | F-Oxylab |
| Mass account warming | HD-Geonode | HD-Packetstream |
| Sneaker / Queue-it / bank flows | FP-Mobile | ET-Mobile / ISP Static |
| Authenticated workflow needing same-IP | ISP Static | FP-Mobile |
Honest caveat — pool quality drifts
Every benchmark on this page will be slightly wrong in three months. Anti-bot vendors push fingerprint updates, suppliers retire IPs, fraud waves trigger ASN-wide flags, and what was the cleanest pool for Cloudflare in May becomes mid-tier by August. We’ve watched this cycle play out enough times to stop being surprised.
The right strategy isn’t to read this post, pick one brand, and commit a year of budget. The right strategy is:
- Pick 2-3 brands for your target from Table B.
- Run a bake-off on a small bucket of your real traffic — not synthetic tests.
- Set up a success-rate alarm in your scraper. When the winner drops below threshold, rotate to the runner-up.
- Re-test quarterly.
That’s the entire reason we run aggregated billing across 14 brands rather than a single-brand resell — so customers can hot-swap between pools on a single wallet without re-onboarding every time the leaderboard reshuffles.
Compare current pricing for all of them on the All 14 brands compared page, browse the Residential Proxies catalog, or if your target tolerates it, start with the IPv6 Datacenter at $0.085/GB and see how far it carries you. The cheapest experiment is the one you actually run.